How to Build Dynamic Filters in Tableau Dashboards
Dynamic filters in Tableau dashboards allow you to filter data based on the user's interaction with the dashboard. This can be done by using parameters, calculated fields, or custom filters.
1
Open Tableau and Connect to Data Source
Launch Tableau and connect it to the data source you want to visualize.
2
Drag and Drop Fields
Once connected, drag and drop the fields you wish to visualize onto the Rows and Columns shelves.
3
Create an Initial Visualization
Choose a chart or graph type to represent the data in your worksheet.
4
Go to Dashboard View
Click on the 'New Dashboard' icon to switch from worksheet view to dashboard view.
5
Drag Worksheet to Dashboard
Drag the worksheet you created into the dashboard.
6
Add a Filter
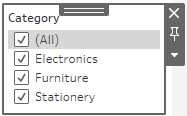
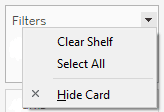
Click on the worksheet inside the dashboard, then click on the 'Show Filters' button.
7
Customize Filter Type
From the filter pane, customize the type of filter you want.
8
Make the Filter Dynamic
You will see a small window beside the sheet where you can choose to apply the filter to all worksheets or select specific ones you want to apply it to.
By building dynamic filters in your Tableau dashboards, you can create more interactive and engaging experiences for your users. This can lead to improved data analysis and decision-making.


