How to Use Intercom Analytics for Support Trend Analysis
Using Intercom Analytics for support trend analysis in Intercom is a great way to understand how your customers are using your product or service and identify areas where you can improve your support.
1
Log into Intercom

Access your Intercom dashboard using your credentials.
2
Navigate to 'Reports'
From the Intercom dashboard, locate and click on the 'Reports' tab on the left sidebar.
3
Select 'Conversations'
Within 'Reports', click on 'Conversations' to view all your interaction analytics.
4
Use the Time Filter
Adjust the time filter to focus on a specific range, e.g., the past month, quarter, or year.
5
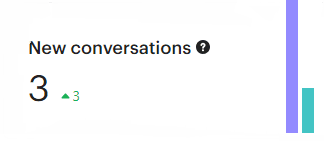
Analyze Busiest Period for New Conversations
Review the data in Intercom to identify periods with the highest influx of new conversations, helping to determine your support's busiest times.
6
Dive into New Conversations by Day and New vs. Conversations Replied To
Segment the data to see the distribution of new conversations each day and compare the number of new conversations to those that received replies.
7
Observe New Conversations by Channel and Closed vs. Reopened Conversations
Analyze the sources of new conversations and compare the number of conversations that were closed to those that were later reopened.
8
Investigate Customer Satisfaction
Check CSAT scores over time. A downward trend can point towards emerging dissatisfaction.
9
Export and Share
Once you've gathered insights, click ‘Email PDF’ and share it with relevant stakeholders.
Support trend analysis can help you to improve your customer support, increase customer satisfaction, and reduce churn. By using Intercom Analytics, you can easily track and analyze support trends and make informed decisions about how to improve your support team.

